Same Height, Five Times the Carbon
The World Bank has paid Costa Rica US$33,983,540 for the carbon in its forests, the latest such sale since the 1990s. Nobody counted that carbon. The tonnage is an estimate turning on one looked-up number: what a volume of wood weighs. It is not the only borrowed figure.
Costa Rica has been selling the carbon in its forests since the 1990s, when Norway's foreign ministry and a group of Norwegian hydropower companies bought offsets from it. The buyer now is the World Bank. Under a contract with the Forest Carbon Partnership Facility worth up to US$60 million for 12 million tonnes of carbon dioxide, covering 2018 to 2024, it has been paid US$33,983,540 so far. To collect, the country has to report both what its forests kept from being released and what they took out of the air, in three monitoring reports, each independently verified before a payment goes out. Two are in. Between them they credit Costa Rica with 6,896,708 tonnes, all but 100,000 of which were paid at the Facility's floor price of US$5 a tonne. Each report lands years after the forest it describes: the one covering 2020 and 2021 was delivered in June 2024, and the third and last, covering January 2022 to December 2024, was due around May 2026.
A second arrangement pays for the wood itself. The Architecture for REDD+ Transactions, which issues forest-carbon credits to whole countries, awarded Costa Rica 1,095,881 credits in June 2026 for forest restored between 2017 and 2019, the first removals credits it had issued to anyone. A reduction credit is paid on a tree that was not cut. A removals credit is paid on wood that grew, so the payment depends on what the new growth weighs.
Nobody counted any of that carbon. The accounting covers 3.1 million hectares of forest. The carbon figures behind it come from 289 national inventory plots and 100 temporary ones. Costa Rica scales that sample up to a national figure and reports it to the single tonne. The money paid so far covers four years and works out at about eleven dollars a hectare.
Equations do the scaling. On each plot a crew measures the trunks, an equation turns those measurements into a weight of wood, and that weight is carried across the millions of hectares nobody visited. One term in the equation is never measured on any plot: what a given volume of the wood weighs. That number is looked up. Costa Rica files a second figure with the UN, a national account of what its forests released and took back, and it is built the same way.
Walk the Osa Peninsula and you will pass a peine de mico and a nazareno standing the same height, the same thickness through the trunk, with the same spread of crown overhead. Dry a block of each and weigh it against the volume it filled when fresh, and the peine de mico comes in at 0.18 grams per cubic centimeter, the nazareno at 0.83. For a trunk of the same size, the nazareno holds close to five times the carbon. From the trail they look alike. To an aircraft flying a laser over the canopy to weigh the forest below, they look alike too. The instrument reads the height and spread of each crown and infers the rest.
Every one of those 6,896,708 tonnes began as a number somebody looked up in a table. Costa Rica reports the total to the single tonne. How much of that precision is real?

The number you look up
Hold a sample of wood in an oven at about 103 degrees Celsius until it stops losing weight, weigh it, and divide by the volume it filled while sap still moved through it. Foresters call that ratio basic wood density. A crew measures the trunk with a tape and a clinometer sighted on the treetop. An equation estimates how much wood is standing in it. Multiply that by the density and you have a weight, of which carbon is 47 percent. For the density, someone has to take a piece of the tree.
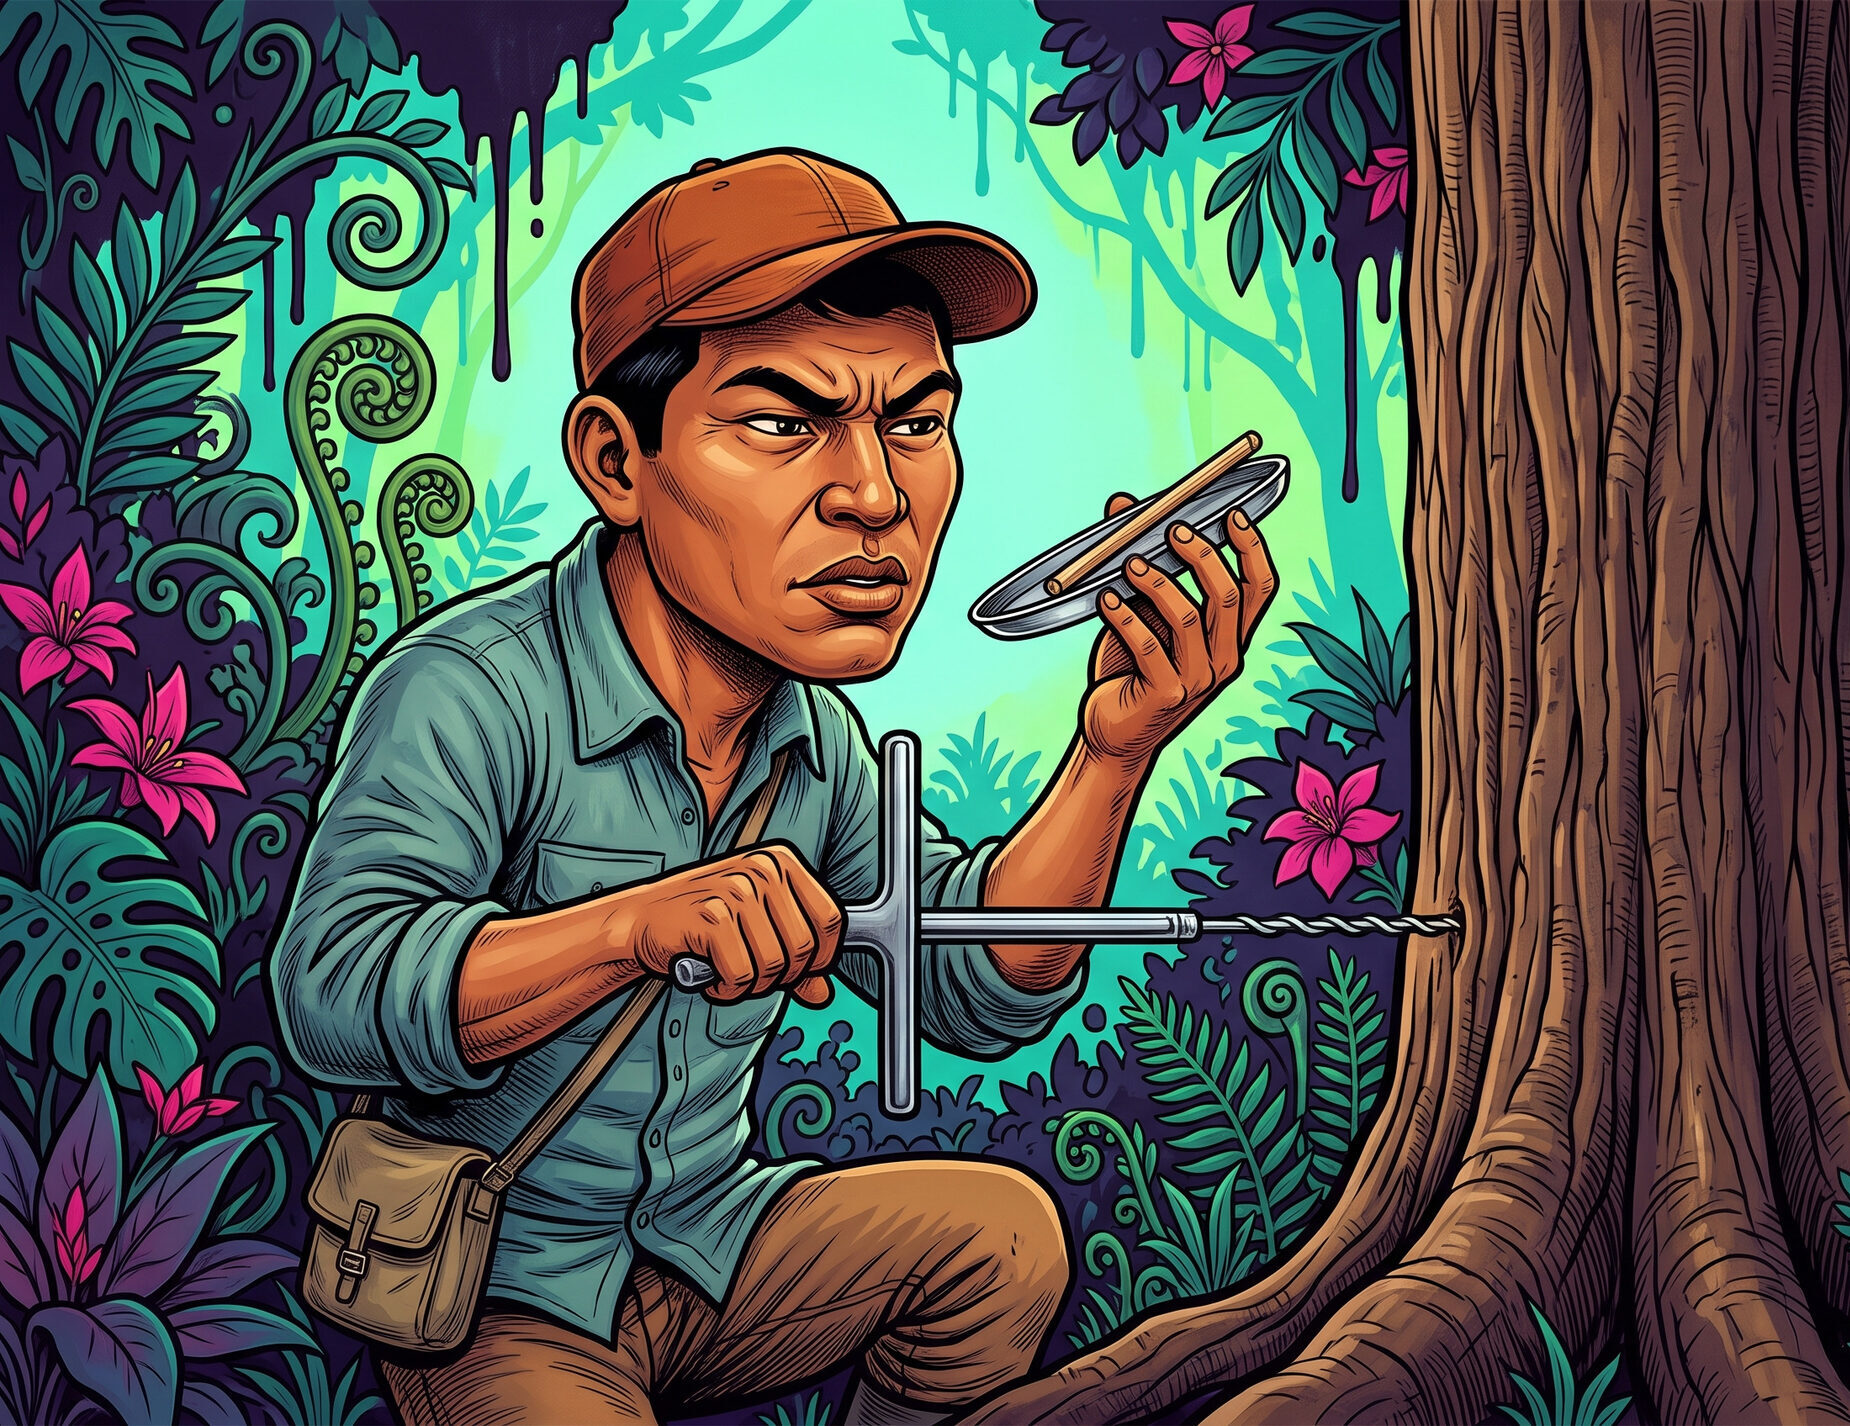
Cutting the sample out does not require felling the tree. A Pressler borer, turned into a living trunk by hand, pulls a core about five millimeters across, thinner than a pencil; the wound closes and the tree goes on. Three faster instruments take no wood at all: a spring-loaded pin fired into the trunk, a nail driven in and pulled back out, and a drill that records the resistance it meets. Each is calibrated against the oven-dry measurement.
Coring and drying every stem on a real inventory would take longer than anyone has. So the typical crew almost never measures a density. It instead identifies the species of each tree and reads the number off a table, usually the Global Wood Density Database, which pools measurements made around the world and yields one average per species. Each record carries the region it came from, so a species measured on more than one continent can be read as a world average or as a Central American one; the Osa figures in this piece are its Central American records.
The shortcut costs something: a fast-grown individual and a slow one of the same species come out identical on paper. And the table is no use until somebody has stood in the forest and named the species. Across most of the tropics, nobody has. A satellite is handed a single average for the whole forest beneath it instead, because working out which species actually grow there is the harder problem. A study published in 2025 set out to attack it.
Halving the error
In March 2025 a team led by Martin Sullivan published, in Nature Communications, a study of how wood density varies across tropical and subtropical South America. Their raw material was 981 forest plots on the continent with the largest share of its land under forest, and more tree species than any other. They did no fieldwork of their own. The plots came from fourteen research networks that have been measuring them for decades, pooled in a shared database, each plot a patch of ground where a crew had measured every trunk over ten centimeters across and named as many of them as it could. Across the set, 85 percent of stems were identified to species.
For each plot they turned that list of trees into a single number. Every stem was mapped to the published density for its species; those values were then averaged across the plot with each tree counting in proportion to the cross-section of its trunk, so the big trees dominate the average as they dominate the carbon. That resulting number is the stand average, low where light-wooded pioneers hold the ground and high where slow hardwoods do. Across the 981 plots the heaviest stands came in at about twice the lightest, around a mean of 0.63 grams per cubic centimeter.
Then they asked whether that number could be predicted for a plot nobody had visited. They fitted statistical models to the 981 stand averages three times over: on the plot's coordinates alone, on its climate, soil and terrain alone, and on both together. Even the crudest cut of the data worked. Sorting the plots into eight broad regions, from the northwestern Amazon lowlands through the Guiana and Brazilian shields to the Andes, the Atlantic forest and the dry forests, accounted for a third of the variation on its own.
Soil came next, through its fertility, its acidity and its texture. The depth at which it met rock and how broken the terrain was turned out to matter little. The team went in expecting fertile ground to favor faster-growing species, and fast growers to build lighter wood. That is the direction the data took: in the models built on climate, soil and terrain alone, wood density fell as soil fertility rose. However, adding the plot's coordinates weakened the relationship.
Climate mattered less than soil. Drier forests were thought to hold denser wood, and earlier work inside the Amazon had found that. However, across the continent Sullivan's team found no clear relationship between wood density and dry-season water availability, temperature, or cloud cover.
The map they produced traced in finer detail a gradient already known from the Amazon, where plots in the west hold lighter-wooded species than plots in the east. It also extended predictions into the Andes, the dry forests, and the Atlantic forest, where no such gradient had been mapped.
The model is meant to improve carbon estimates made from orbit, so Sullivan's team worked out by how much. They estimated the carbon in all 981 plots and measured every attempt against one reference: the figure you get by identifying each tree and looking up its species. The old way, giving every stand a single continental average, came out off by a median of 8.4 percent. Using the model to predict each stand's average from its location brought that down to 4.5 percent. Part of what is left is the model's own imprecision. The rest is innate to working from a stand average at all. Given each plot's observed mean, the best any model could predict, the estimates still missed by a median of 0.8 percent, because one number for a whole stand cannot say which trees inside it are heavier and which are lighter. Sullivan's model gets about halfway to that floor.
Their map is built for forests where no one has run a plot survey. Species is the strongest single control on how heavy a tree's wood is. Only a ground survey that identifies and measures every tree on the plot, they wrote, can remove the error the map leaves behind.
What sets the average
No wood was sampled for any of this. Every stem's density came from a published average matched to its identification, tree by tree, the way an inventory does it. That worked for 46 percent of stems. The rest were trees never identified past genus, or species the database had no entry for. Those stems took the genus average, or failing that the family average, and one stem in twenty-five took the average of the plot it stood on.
Which species grow where changes from one stretch of landscape to the next, and that much was already understood. Sullivan's team added a way to predict what that mix weighs, across a continent, partly from the ground itself and partly from bare position on the map. Soil tracks how heavy the stand is, because it tracks which species assemble there, so a sensor that cannot resolve a single trunk can still be handed a density for the forest beneath it.
The same is true inside a single Osa forest, where the mix changes quickly from ridge to slope to floodplain. The peine de mico sits at the light end and the nazareno at the heavy. Between them, cativo and cedro cluster in the low 0.4s, and pilón and manú (Minquartia guianensis) near 0.6.
Florian Hofhansl and colleagues went to the Golfo Dulce to ask what makes one patch of forest hold more carbon than the patch beside it. They laid out 15 one-hectare plots across ridges, slopes and ravines, ground whose soil and drainage change over short distances, and measured every stem more than ten centimeters across. Aboveground carbon ran from 114 to 172 tonnes a hectare inside that one stretch of coast. It rose with the phosphorus in the soil, an R² of 0.45, and with the community's mean wood density, at 0.43. An R² of 1 would mean the one figure predicted the other exactly, and 0 that it told you nothing. Density falls short of 1 because a plot's carbon is its density multiplied by how much wood is standing there, and a plot can hold light wood in quantity. Their path model has the soil acting indirectly: it governs the nutrients on hand and the mix of species that assembles, and those set the carbon.
The same team went back with a different question: whether a tree's wood is set by the ground it stands on or by the species it belongs to. Wood traits tracked the soil, the shape of the ground and the water available, but most of the variation went unexplained by anything they recorded in the environment. They took that as a limit on predicting a single plant's traits from its surroundings. Species carries most of it. Fischer, Chave, Zanne and colleagues, working through the global database, put about 15 percent of wood-density variation inside species rather than between them, and still found an individual plant's density difficult to predict.
A biomass equation is built from trees that were felled and weighed, so that a crew can go from a trunk's diameter and its wood density straight to a biomass figure. Svob and colleagues took pre-felling inventories from five conservation areas in Costa Rica and applied Chave's 2005 equations for wet and moist forest, the same equations Costa Rica's national accounting runs on. Their simulation was designed to separate the error contributed by the density figure from the error contributed by the equation itself. It turns out that the equation is the bigger source. An equation like that uses a model of the average tree of a given thickness, but no two trees of that thickness hold quite the same amount of wood. Whatever density goes in, that spread leaves a single tree's biomass uncertain by a minimum of 37 percent. (The 37 percent is Chave's figure. Svob put no other equation through the same test.) Density adds 11 percent of uncertainty on top of that when it is the published value for the tree's species, about 15 percent if the genus-level lookup is used, or 28 percent when it is based on one average for the whole conservation area. So the lookup method leaves an individual tree's biomass uncertain by somewhere between 48 and 65 percent, based on which estimate for density is used.
That range is the error when the equation is applied to a single tree. The errors partly cancel once the trees are added up: a density read too high on one trunk against one read too low on the next, and the more trunks in the total the more they offset. Svob's figures for a whole inventory, every tree recorded under one management plan, fall to between 2 and 17 percent. Sullivan's misses, 4.5 percent with the model and 8.4 without, sit so far below the per-tree numbers because they are errors on a sum of hundreds of trees rather than on any one of them. Leaving density out of the equation altogether does something different again. At Tirimbina, on the Caribbean slope, one equation took trunk diameter and height, another took diameter, height and wood density. The first estimated 17 to 33 percent less biomass than the second, and it fell short every time rather than scattering both ways.
The densities fed into Chave's equations come from published tables. A Costa Rican equation exists alongside them: Shu Wei Chou and Edgar Gutiérrez-Espeleta built one in 2013 from 907 trees in Corcovado, using basic densities measured species by species at the University of Costa Rica's forest-products laboratory, since renamed the Unidad de Recursos Forestales.
A species value does not pin down an individual tree, whether it comes from a global table or from the UCR laboratory. It is one number for the whole species, and individual trees measure above and below it. Wood changes from pith to bark as well, though not in every species: Plourde and colleagues found it in 42 of the 74 Caribbean-lowland species they tested, usually growing heavier outward. Two samples from the same trunk can therefore disagree.
A species' density changes far less from place to place. Cedro amargo was sampled across the Nicoya Peninsula in bands of increasing rainfall, from the dry north to the wetter south. Its traits varied significantly between the drier bands, but its wood density moved least of all, barely 0.01 grams per cubic centimeter across the whole gradient. That is what makes the lookup workable, and what lets a map predict density by predicting species.
Sullivan's map is built from species means, so it can carry no more detail than they do. The team wrote that treating density as a fixed property of a species was the only approach a study on that scale could afford, and that the patterns would sharpen if the variation within species were folded in. The map predicts which species stand where. It cannot reach inside a single trunk.

Everything but the map
Costa Rican carbon studies reach for the same global compilation everyone else does. The values behind the Tirimbina estimate and the figures in a recent Golfo Dulce carbon survey trace back to it, and Svob's study leaned on it too, topped up with the handful of Costa Rican measurements in the literature. Sullivan's map does not fix that, because its values come from the same table. We have not seen anyone ask whether the world's average for a species matches what that species actually builds in Costa Rica. The country has a laboratory that has measured exactly that, and the national accounting does not name it among the sources it draws densities from. Those are a national SINAC tool, a global agroforestry database, IPCC default values and a Costa Rican palm study, assigned tree by tree from the identification.
Costa Rica is already on a wood-density map. Fischer, Chave and Zanne published one in 2025, a preprint covering every woody biome on earth at kilometer resolution. No one, as far as we can find, has built the higher-resolution Costa Rican version: the equivalent to the map Sullivan's team built for South America, made from measurements taken here. Take those measurements and the country's maps of climate, soil, and forest type, and you could say what the wood weighs in Sarapiquí, on the Osa, or in Guanacaste.
The Osa's forest carbon has already been read from the air. An airborne laser flown over it by the Carnegie Airborne Observatory found aboveground carbon ranging from 25 to more than 225 tonnes a hectare across the peninsula. It read that carbon off the canopy, over ground where no one has run plots, but did not use a density layer of the kind Sullivan built.
What the plot misses
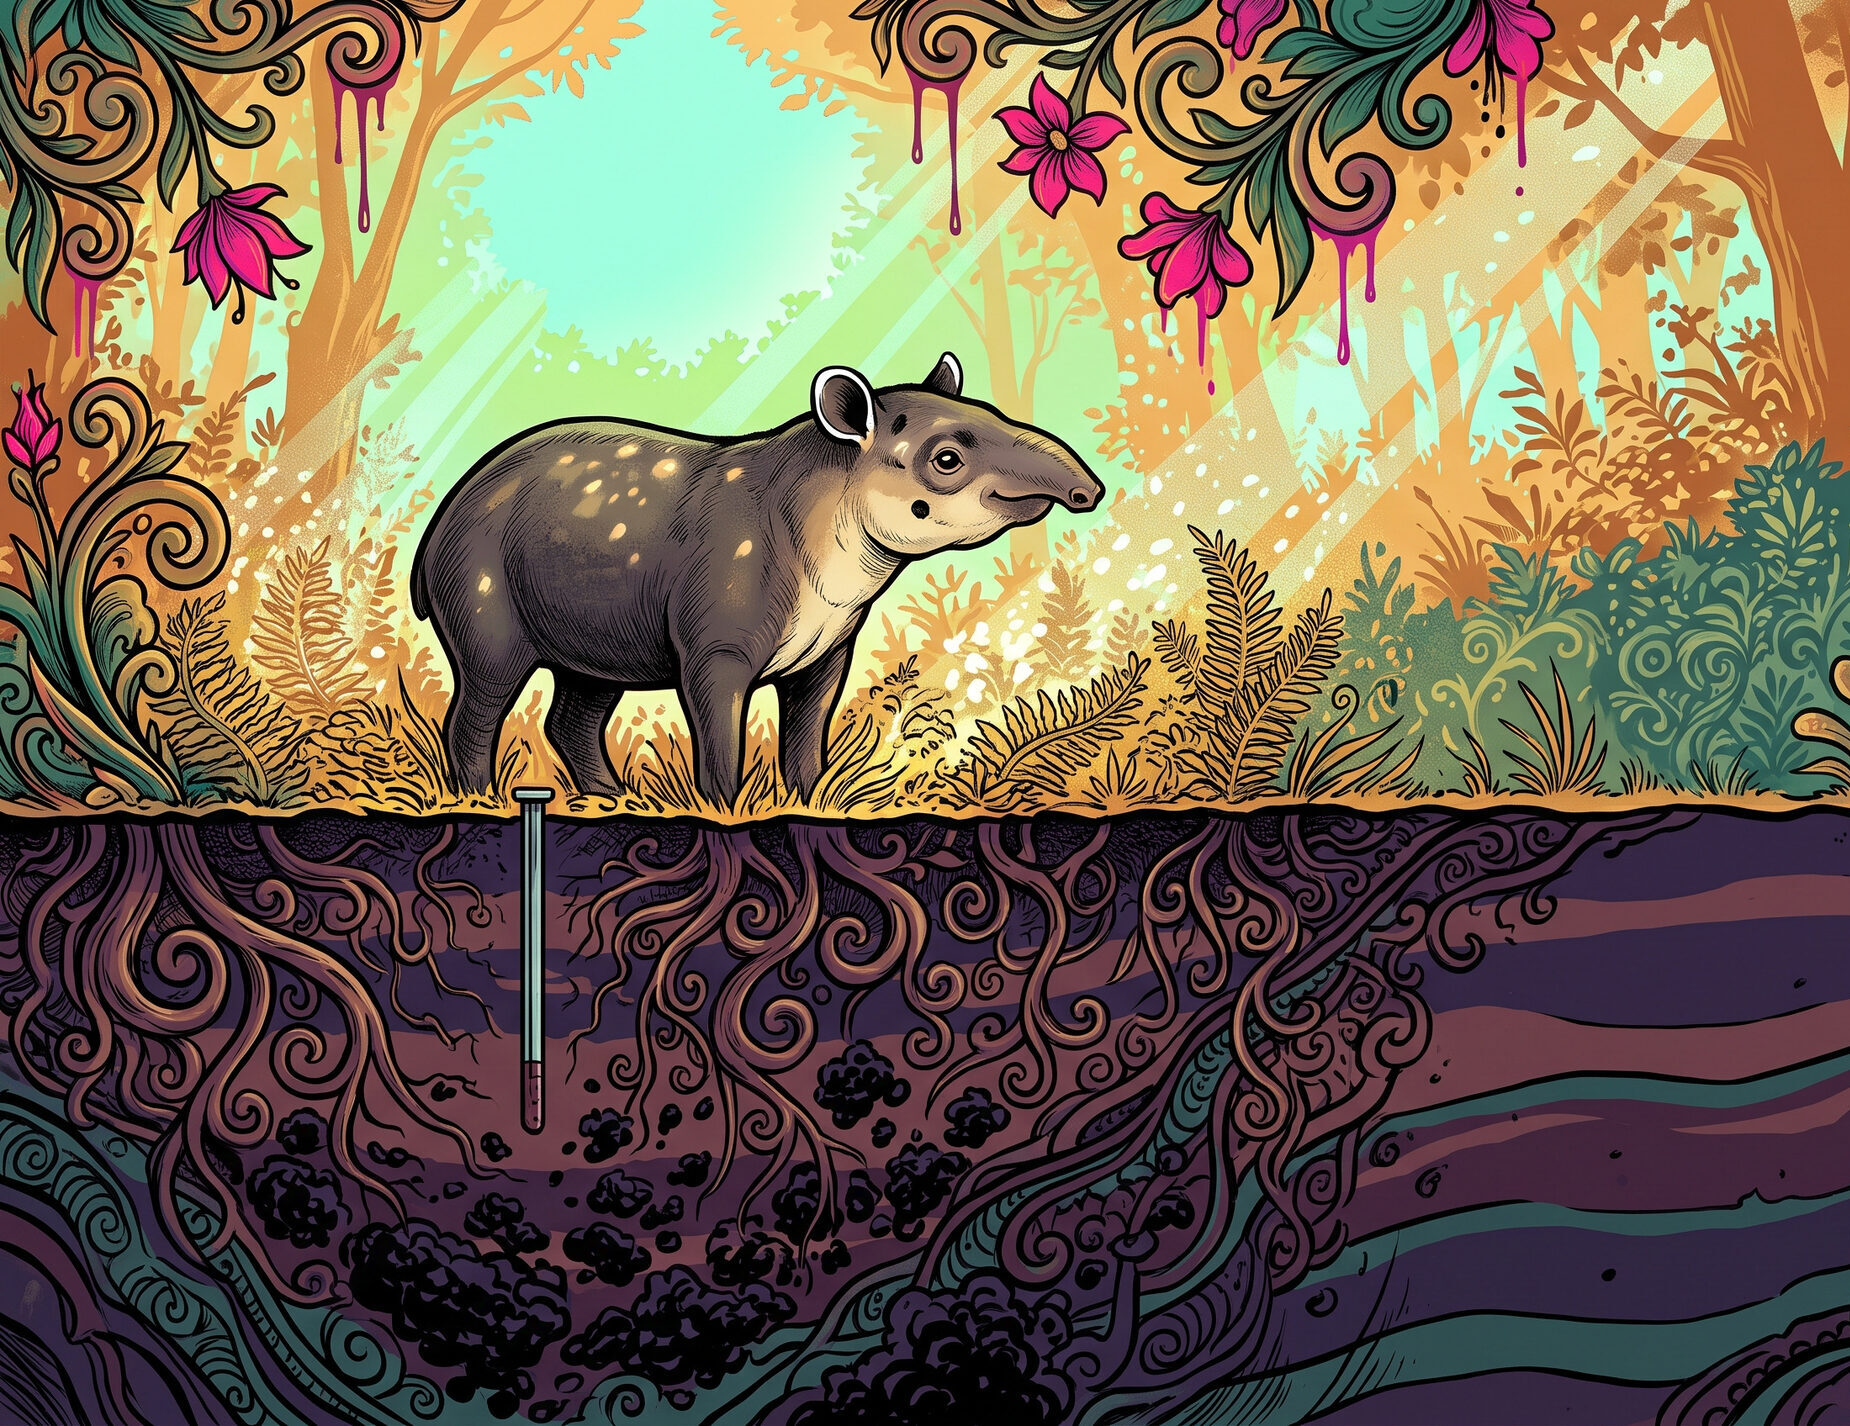
A national inventory counts the trees. What it leaves out can hold more carbon than what it counts. Below the trunks, in Costa Rican secondary forests, between half and five-sixths of all the carbon is in the ground rather than the standing vegetation. A 2026 landscape carbon study in Costa Rica mapped the carbon in the trees of a fragmented valley and ignored the carbon in the soil; its authors note that pasture holds a great deal of carbon underground, so leaving the soil out understates that land use.
Even inventories that do sample soil usually stop at 30 centimeters, the IPCC's default accounting depth. That depth happens to match the reach of a plow, 25 to 30 centimeters, the layer tillage agriculture cares about. In the mountains of western Panama, just over the Costa Rican border, a 2025 study sampled soil to a full meter and found the deepest layer it dug, 50 to 100 centimeters, holding 93 to 246 tonnes of carbon a hectare in its highest plots. Total soil carbon rose strongly with elevation across the gradient, which ran from 880 to 2920 meters. A 30-centimeter core stops above that layer entirely. At La Selva, the species of tree overhead governed how nitrogen and phosphorus moved through the ground below.
Clearing a patch of forest eventually releases the carbon in the trees that come down. It also thins the forest left standing. Wind and sun reach in along the new boundary, the big trees die back, and in tropical forest that influence runs roughly 800 meters inward, further than in any other biome. A 2025 study of eight million forested locations found aboveground biomass in the world's edge zones 16 percent lower per hectare than in the interior: still forest, just carrying less. Seventy percent of the world's forest lies within a kilometer of an edge, so that thinning is no fringe case: global forest biomass stands 9 percent below what it would be with no edges at all, a standing deficit of 58 billion tonnes rather than an annual loss.
Planting the gap between two blocks of forest adds the carbon that grows on the ground it covers, pasture giving way to trees. That much any project can count, and connection speeds it up: across Brazil's Atlantic Forest, regrowing stands put on carbon 43 to 69 percent faster in well-connected landscapes than in fragmented ones. But, interestingly, the planting also joins two edges. The 800 meters on each facing side stop being a boundary, and as the young trees between them rise, in principle the two bands should thicken back toward what the interior carries. That second gain lands inside forest that was already standing and already counted as forest. Tier 1 methods, the default an inventory falls back on when it has no measurements of its own, assign one carbon value per vegetation type, so forest is forest whether it stands in the interior or along an exposed edge, but nothing in the ledger moves.
Counted once
A carbon figure is a moment in time, and these forests do not hold still. One Costa Rican plot network recorded its secondary forests losing biomass over a measurement window rather than gaining it, the opposite of what an inventory books when it credits regrowth as stored carbon. The figure rests on six secondary-forest plots inside a network of more than four hundred. The scatter is wide enough that the true figure could be zero.
Regardless, it is empirically true that a forest is always dying as well as growing, and mortality never falls to zero. Rozendaal and Chazdon tracked six second-growth stands in northeastern Costa Rica, aged between 10 and 41 years, for up to sixteen years. Growth drove the biomass early on; later, mortality weighed as heavily.
Drought raises those mortality rates sharply, but not for all species alike. When the 2015 El Niño struck the dry forests of Guanacaste, Jennifer Powers and colleagues found mortality ranging from nothing measurable in some species to a third of the trees in others. The trait that sorted survivors from the dead was hydraulic: how close a species sits to the pressure at which its internal water columns break. Size and leaf type predicted nothing.
Wood density looks like it should sort the survivors. Across biomes, Greenwood and colleagues found species with denser wood dying less in drought. However, in Guanacaste, Powers and colleagues found no such signal. Density tracked neither drought vulnerability nor the hydraulic traits that did predict it, and they wrote that the result casts doubt on using traits of that kind to predict which trees a drought will kill.
Moreover, a typical inventory records the carbon standing on a plot, but nothing about the trees that fell. They have not left. A dead trunk gives up its carbon over years as it rots. The more heavily a forest has been logged, the more dead wood is lying on it. Pfeifer and colleagues, working across stands in Sabah, on Malaysian Borneo, logged to different degrees, found dead wood holding as little as 5 percent of aboveground carbon in the least-disturbed old growth, versus more than half in stands that had been salvage-logged. Carbon studies, they note, have mostly counted live standing biomass alone.
We have found no published Costa Rican study measuring what the 2023–24 El Niño, the strongest since, did to the country's forests. And, not every forest is equally exposed: the wet forest at La Selva absorbed the extreme 1997–98 El Niño and held structurally steady across four decades.
Measured here
Every tonne of carbon Costa Rica reports to the UN began as a density read off a table built from the world's trees. Costa Rican trees have been measured, species by species, at the University of Costa Rica's forest-products laboratory. The national accounting names four sources for the densities it uses. That laboratory is not among them, and no one we can find has tested whether its figures would move the national total. The national total is a subtraction: the forests give carbon back when they are cleared and take it up when they grow, and the country reports the difference between the two. Each side comes to millions of tonnes, with a margin of up to 26 percent. The difference between them is 76,938 tonnes. An error of even 2 percent on a five-million-tonne side is larger than that. The margin Costa Rica reports on the total is 445 percent, several times the total itself. The borrowed densities are not inside that margin. The accounting rates them a low source of error and leaves them out of the propagation entirely.
Costa Rica does plan to improve the count. Its 2025 filing names four things it will work on: re-estimating forest-area change from a sample, telling plantations apart from secondary forest, modelling growth in palm forests and mangroves, and estimating soil organic carbon. Soil is on the list. Wood density is not, and neither is the thinning along a forest edge, the dead wood on the ground, or a second visit to see what a drought took.
What a Costa Rican density map would need already exists. The country has permanent plots maintained for decades by CATIE and by the Universidad Nacional's forestry research institute, a national forest inventory, a forest-products laboratory with measured wood densities, soil cores, and long-term records that caught the droughts. Nobody has yet put them together. Sullivan's team did exactly that for South America, turning 981 plots into a map of what the wood weighs and cutting the error on a plot from 8.4 percent to 4.5. Costa Rica's 445 percent is the error on two large numbers set against a difference of 76,938 tonnes. Narrow that error and the margin narrows with it. Wood density has been left out of it on the assumption that it is small. Costa Rica has the measurements to find out whether that is true.
Resources & Further Reading
Wood density and the spine study
The anchor study: wood density mapped across 981 plots in tropical and sub-tropical South America, halving biomass-prediction error against a mean-only baseline. Open mirror at the University of Edinburgh Research Explorer.
The basis for the qualified superlative on Sullivan's continent: South America has the highest proportion of forest, 49 percent of its land area, while Europe holds the largest absolute forest area, 25 percent of the world's total.
Source for the tree-diversity half: roughly 43 percent of all Earth's tree species occur in South America, ahead of Eurasia at 22 percent.
"Towards a worldwide wood economics spectrum," the worldwide compilation of species mean wood densities that field inventories look up.
Source for the peine de mico (Apeiba tibourbou) basic density of 0.18. Its tables also show 0.14 in old growth against 0.22 in the youngest second growth, but the paper reports specific gravity varying significantly across successional stages only in Guatteria amplifolia, not in this species, so that difference is not a finding.
Radial pith-to-bark density change found in 42 of 74 species tested, usually increasing outward.
Cedro amargo traits differed significantly between the drier precipitation bands of the Nicoya Peninsula; wood density varied least of the five traits, and not at all between the driest and wettest bands.
Source of the 0.47 tropical carbon fraction, the definition of basic wood density as oven-dry mass over green volume, and the tropical species density table.
Establishes that standing-tree acoustic tools measure stiffness, not wood density, and in fact require green density as an input.
The global counterpart to Sullivan's continental map: temperature is the dominant driver worldwide and dry forests run up to 31% denser, a useful contrast to Sullivan's continental climate null.
The team that assembled the global database took it apart to ask how much of the variation one value per species misses: "Intraspecific variation accounted for c. 15% of overall wood density variation," and "individual plant wood density was difficult to predict (root mean square error > 0.08 g cm−3; single-measurement R2 = 0.59)."
A preprint, not yet peer-reviewed: 109,626 wood-density measurements and 300,949 vegetation plots combined into a kilometer-scale map of community-weighted wood density for every woody biome, Costa Rica included. It also confirms that the Global Wood Density Database reports basic density, oven-dry mass over green volume.
The Osa timber manual, 195 species. Source for the common names behind the density band, and the reason manú needs its binomial: it assigns that name to Minquartia guianensis, Caryocar costaricense and Vitex cooperi alike. Its densities are air-dry throughout, not basic.
Increment (Pressler) borer, torsiometer, Pilodyn, nail withdrawal, and resistance drilling (Resistograph), each benchmarked against oven-dried core density.
Increment coring and tree health
The review that maps the debate: coring is usually low-risk, sometimes fatal, the reassuring evidence is thin and weighted toward temperate species, and a wound closed on the surface can still hide internal decay.
The one tropical field trial we could find: 35 trees of 11 species in Singapore followed for a year, one dead, and species the only predictor of whether the hole closed.
A ten-year dissection of 78 boreholes in four species: the tree walls the wound off and grows around it, most sealants barely change the outcome and a creosote plug makes it markedly worse, and a single hole left a stain column up to 2 meters long in birch.
The CODIT model, built by dissecting about 10,000 trees: wounded wood is walled off by the tree, and the barrier against spread up and down the trunk is the weakest, which is why coring damage travels vertically.
935 cored trees against 8,605 uncored across 19 species in Virginia, with no mortality difference over seven years.
White and red fir in the Sierra Nevada showed no mortality difference twelve years after coring, though the authors warn other species may be more sensitive.
551 cored Norway spruce against a matched uncored control group, with no mortality effect about forty years after coring.
Costa Rican biomass, carbon, and remote sensing
Aboveground vegetation carbon (114–172 t/ha in the Results; the abstract says 114–200) rose with community-weighted mean wood density (R²=0.43) and soil phosphorus (R²=0.45).
Decomposes trait variation into plasticity, genetic adaptation and phylogeny. Leaf traits varied with canopy-light regime and nutrient availability, wood traits with topoedaphic factors and water availability, and most of the variation went unexplained by the measured environment, "indicating a limited potential to predict individual plant traits from commonly assessed parameters."
Wood density leaves a single tree's biomass uncertain by 11% when the species value is used and 28% when a conservation-area average stands in, about 4 points more at genus level. The allometric model adds 37% regardless of the density used, for a total of 48–65%.
An equation using trunk diameter alone underestimated biomass by 22.6–31.7% relative to one carrying diameter, height and wood density; isolating density alone, the gap was 16.9–32.8%.
907 of 2,129 inventoried trees whose species had a published density (Corcovado 364, Fila Carbón 543); no trees were felled. Wood density correlated only 0.08 with the per-tree biomass estimate yet was kept, with densities from the UCR forest-products laboratory.
Airborne LiDAR found aboveground carbon of 25 to >225 Mg C/ha; geology and slope dominated, climate did not emerge as a control.
The L-band radar signal showed no relationship with estimated biomass across a gradient of Costa Rican forest types.
Radial wood-density variation tested in 18 Costa Rican dry-forest species and found significant in 11 of them; spatial mapping of dry-forest density, however, remains undone.
States that the national forest inventory computes aboveground biomass with Chave et al. (2005), taking specific gravity from Chave et al. (2006).
Source for the permanent-plot network: the Universidad Nacional's forestry research institute (INISEFOR) began installing permanent sample plots in natural forest in the 1980s.
The national forest-carbon accounting: aboveground biomass via Chave allometry with each tree's wood density obtained "from specialized publications" (a national SINAC tool, a global agroforestry database and IPCC 2003 defaults), an aggregated uncertainty of 445% from a Monte Carlo analysis, wood density rated a low error source and left unpropagated, and a planned-improvements list that does not include wood density.
Soil, edges, recovery, and drought
Costa Rica as the first tropical country to reverse deforestation, with forest cover near 60%, and its REDD+ carbon payments built on national forest monitoring.
Total carbon 180.4 Mg/ha at age 20, with 51–83% stored in the soil.
Source of the 30-centimeter default accounting depth: "For Tier 1 and 2 methods, soil organic C (SOC) stocks for mineral soils are computed to a default depth of 30 cm."
Ties the 30-centimeter convention to tillage: "the plow layer is typically 25-30 cm deep." Also gathers the studies finding measurable carbon change below that boundary, which the default depth never sees.
Soil sampled in four increments to 1 m across an 880–2920 m gradient in western Panama. The deepest increment, 50–100 cm, held 92.8–246.3 Mg C/ha in the highest plots; total soil carbon over 0–100 cm ranged 119.0–577.9 Mg C/ha and correlated strongly with elevation.
The tree species overhead, not climate or parent material alone, shaped soil nitrogen and phosphorus supply.
Edge effects have caused an additional 10.3 Gt C of emissions (range 2.1–14.4), which the paper annualizes to 0.34 Gt C per year, 31% of currently estimated annual releases from tropical deforestation.
Mean biomass density in edge areas ran 16% lower than in interior forest, "edge areas" being within the depth of edge influence, which the paper defines as "the threshold distance beyond which biomass density stabilizes and no longer exhibits a notable gradient with respect to edge proximity." Source for the article's tropical figure and for its being the deepest of any biome: "The global mean depth of edge influence was 336 m, with biome-specific averages of 826 m for tropical forests, 235 m for temperate forests and 258 m for boreal forests." Note this is a biomass threshold, deeper than the 100–400 m edge effects on mortality and microclimate reported by the BDFFP work cited elsewhere on this site. Cumulative loss 58 Pg aboveground biomass, a 9% decrease against a no-edge counterfactual, across eight million sampled locations; 70% of the world's forest lies within 1 km of an edge.
By 2020 secondary forest buffered 41.1% of Amazonian old-growth edge forest, 143,392 km², falling to 22.9% if only secondary forest older than 15 years is counted. Where buffering happened it did so within 3 years (2–5) of the edge being created. The paper measures spatial proximity and says plainly that whether a buffer restores interior conditions or reduces edge-related tree mortality remains open, requiring field studies.
Carbon accumulation rates rose 43–69% from fragmented to highly connected landscapes across the Brazilian Atlantic Forest; in the west and coastline, highly connected forest accumulated 3.03 ± 0.81 against 0.93 ± 0.34 Mg C per hectare per year in low-connectivity areas.
Source for the accounting blind spot: Tier 1 IPCC methods assign a fixed carbon stock value per vegetation type without adjusting for edge effects, so fragmentation losses, and the recovery when an edge closes, fall outside the ledger.
Forest stored about twice the aboveground carbon of coffee and pasture in the Atenas landscape; soil carbon was excluded by design.
The origin of the twenty-year figure: 50% of secondary forests recleared within 20 years and 85% within 54, across a 320 km² landscape in southern Costa Rica.
Regrowth reached about 52% of old-growth biomass and 31% of species richness after 20 years.
Reports that wet Costa Rican secondary forests are cleared at an average age of 20 years (after Reid et al. 2019).
Secondary forests showed a negative mean net biomass productivity (−1.55 Mg/ha/yr) over the measurement window, from six plots with a standard error of 2.59.
In the 2015 El Niño in Guanacaste, species-specific mortality ran 0–34% and was predicted by hydraulic safety margins, not size or leaf traits.
The across-biomes result: "Tree species with denser wood and lower specific leaf area showed lower mortality responses." The paper reports no significant difference between angiosperms and gymnosperms, so the finding is not confined to broadleaves. Powers et al. (2020) dispute its reach, reporting that in Guanacaste wood density was "poorly correlated with vulnerability to drought or hydraulic traits," and naming this meta-analysis as the work their result casts doubt on.
Across a degradation gradient in Sabah, coarse woody debris carbon ran from about 10 Mg/ha in primary forest, 5.4% of aboveground carbon, to about 37 Mg/ha in salvage-logged stands, more than 50% of it. The authors note that carbon studies "have either focused exclusively on live standing biomass or have been carried out in primary forests."
Across secondary stands aged 10 to 41 years, biomass gain from tree diameter increment fell with stand age while biomass loss to mortality rose.
The La Selva wet forest recovered from the 1997–98 mega-Niño and stayed structurally stable across four decades (study period 1997–2014).